Sample report
The page your board actually reads
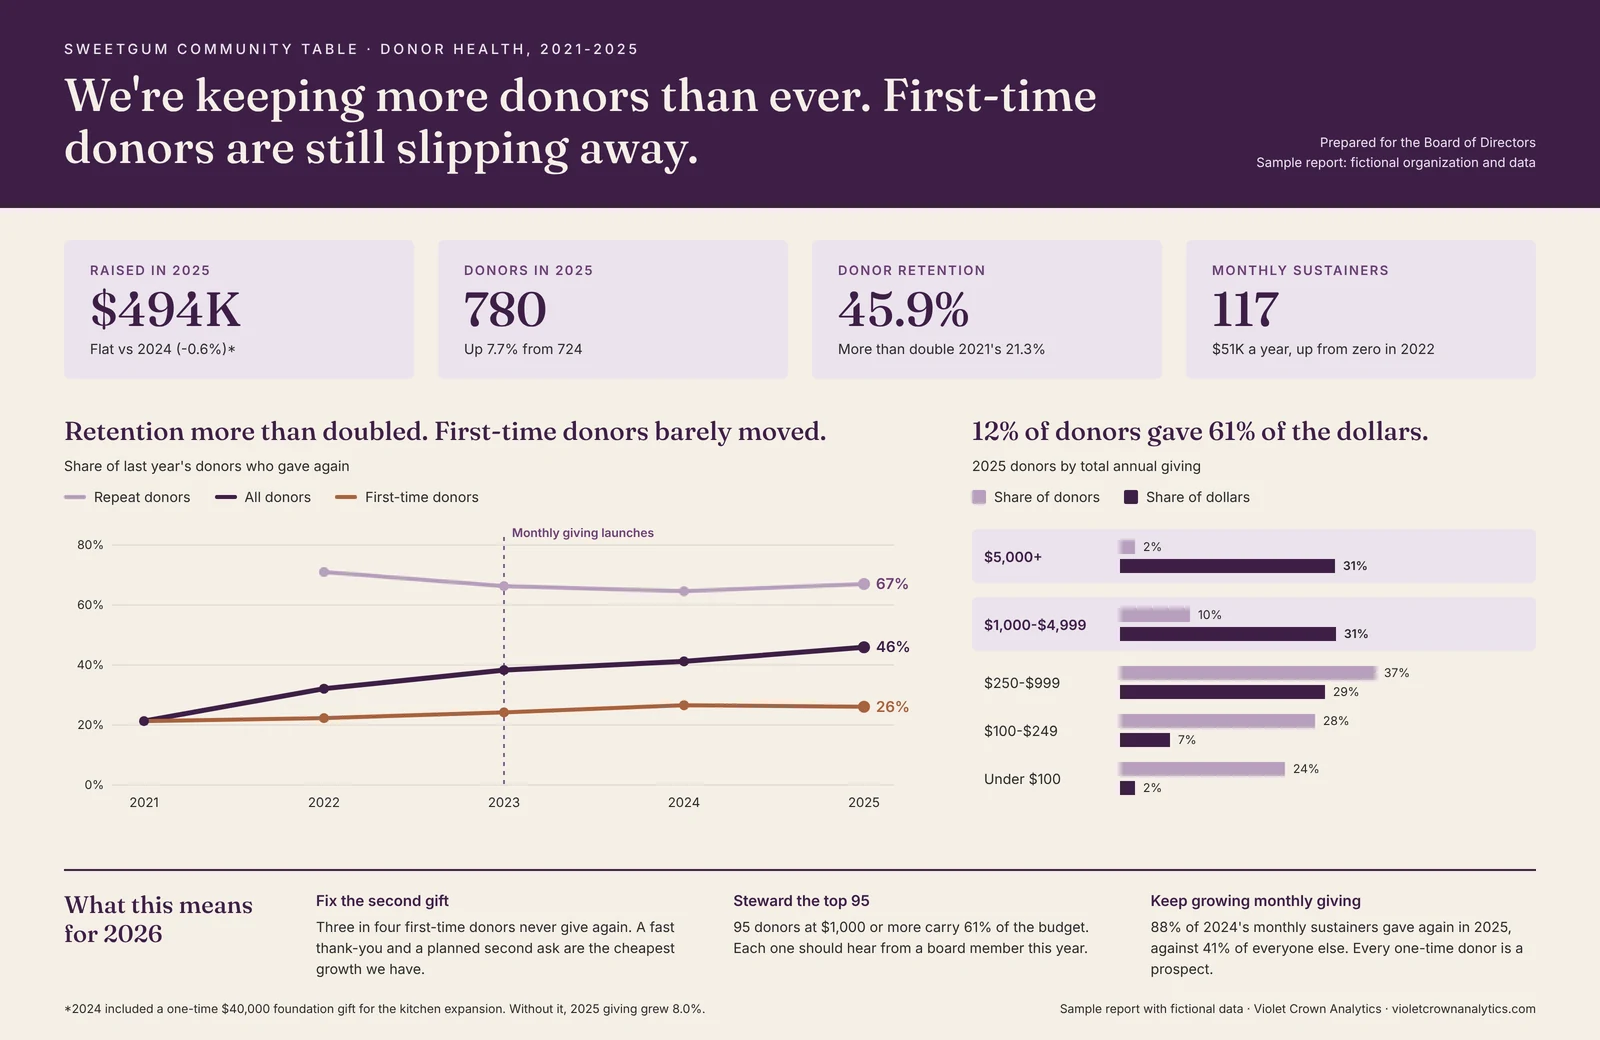
One page, four numbers, two charts and the three things worth doing next. This is what VCA reporting looks like when it goes to a board, a sponsor, a corporate donor or a grant committee.
For a grant application
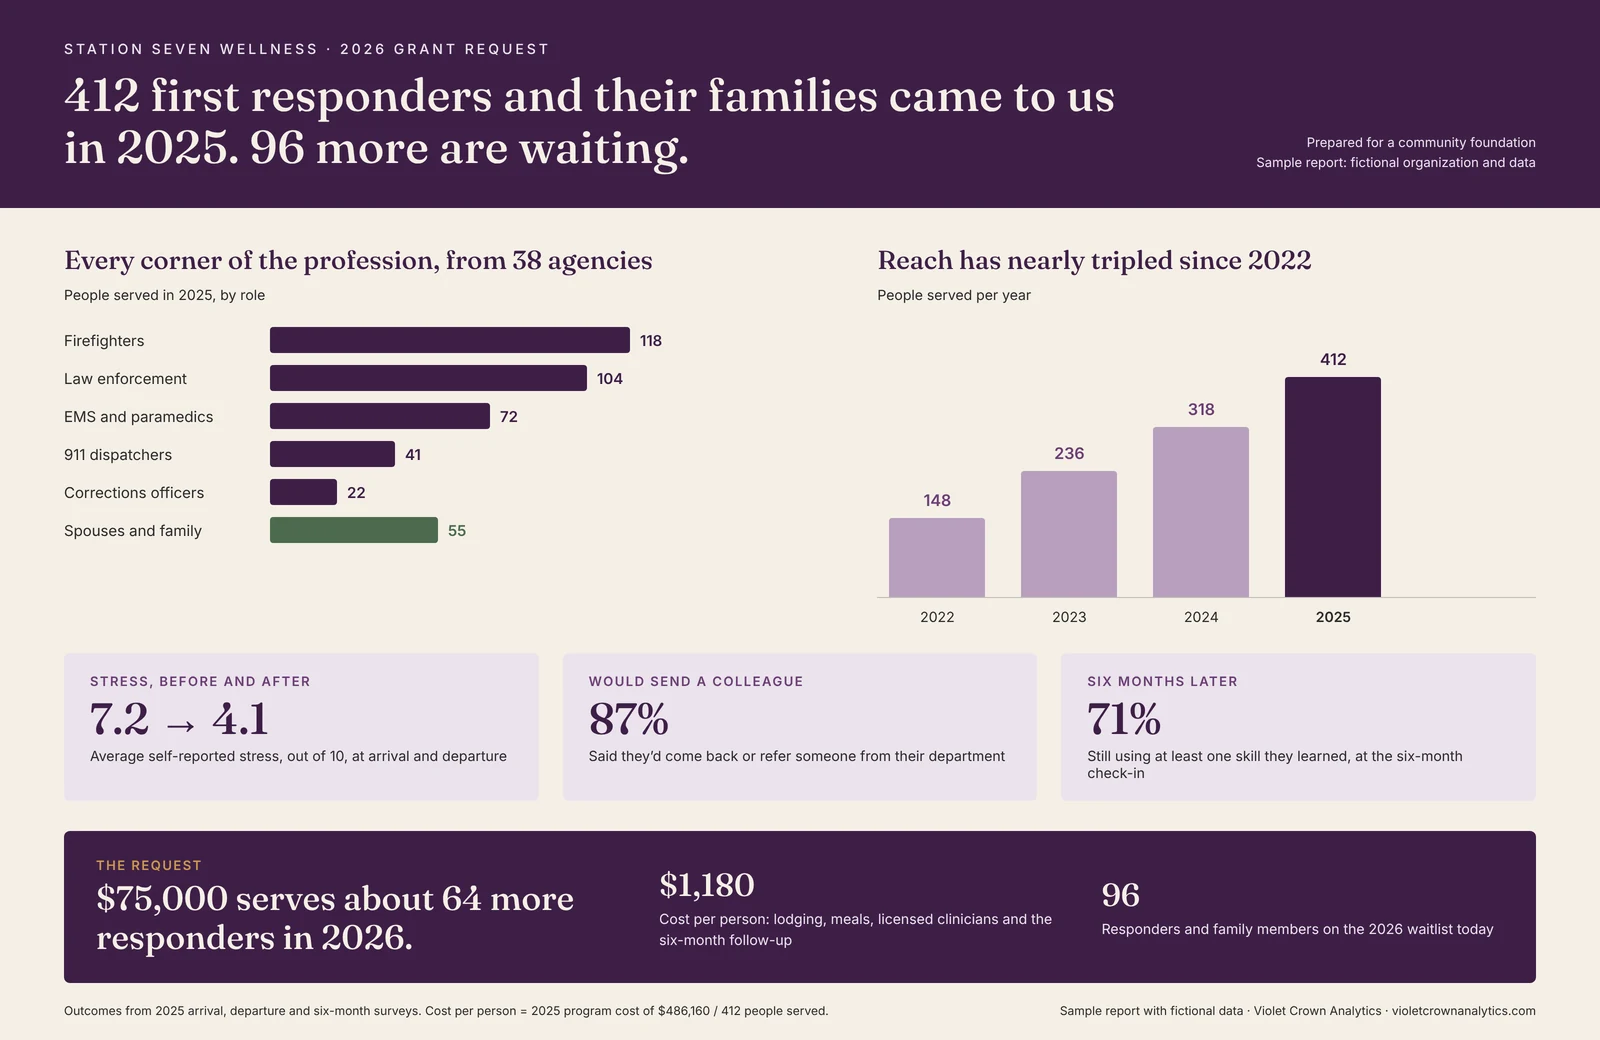
Who you serve, whether it works, and what the money buys
The same approach on a grant request: reach by role, four years of growth, outcomes measured before and after, and an ask with the cost per person printed where a program officer can check it.
Built to be read in a minute
Most board reports are a spreadsheet export with a logo on top. This one leads with the answer: what changed, why it matters and what to do about it. Every number on it comes straight from the donor database and traces back to the gifts behind it.
The headline is a real one for plenty of small nonprofits. Retention is climbing, so the organization keeps more of its donors every year. First-time donors are still the leak: three in four never give a second gift. A board can act on that. It can’t act on a table of totals.
Same data, different reader
- For a board: trends, risks and the decisions in front of them, on one page they’ll actually open before the meeting.
- For a sponsor: what the sponsorship made possible, who showed up and how this year compares to last.
- For a corporate donor: what the gift funded, with the numbers their own community-giving report needs, in a form they can forward.
Where it comes from
It’s built from your CRM, whether that’s Little Green Light, Bloomerang or a spreadsheet that’s been doing a CRM’s job for years. A report like this is the monthly reporting in the Data and Web + data retainers.